What's in a barcode?
Barcodes have been around longer than most of us have. In spite of this, they remain something that most people see and use on a daily basis over 50 years after their creation. But how do they work?

Yet another Monday morning has come around. You woke up slightly later than planned and hastened to the kitchen to rustle together something nutritious and (ideally) unrevolting to bring to work for lunch. To your dismay, the bread that you bought on the preceding Tuesday had gone mouldy. Begrudgingly, you accept that you will have to pick up some fuel en route to the office.
Upon reaching your local store (I’ll leave the choice of chain up to you), you curse those that woke up on time and managed to get their grubby hands on the ham & cheese sandwiches before you. You find yourself doomed to a sentence of egg & cress. Behind your weary eyes sits a wandering mind; what time is my train leaving? Did I lock the door on the way out? I wonder if Janice is going to call in sick (again)? Your racing mind stops as you scan your egg & cress sandwich at the checkout. Suddenly, you think:
How does the computer know what product I’m purchasing when I scan the barcode?
Barcodes are something that most of us see and interact with on a daily, or at the very least, weekly basis. In a world increasingly driven by technology, this in itself may not be surprising. What is unusual about the barcode, though, is its longevity. Despite QR codes becoming the norm for providing a link between physical spaces and the virtual world for things such as menus, review pages, websites, etc., barcodes are still the overwhelmingly popular choice for inventory tracking. Why, more than 50 years after their commercial debut, have they stood the test of time and weathered the storm of technological evolution? To understand and answer this question, we need to travel back to the year 1948.
The History of the Barcode
One day in 1948, Bernard Silver (1924-1963), a graduate of Drexel Institute of Technology, overheard a conversation between the dean of engineering and Samuel Friedland (1897-1985)[5], president of local supermarket chain Food Fair. In this conversation, Friedland was enquiring as to whether it would be possible for somebody at the university to research a system that would automatically capture product information at the point of sale. Despite the dean turning the proposition down, this piqued Silver’s interest, prompting him to approach his friend and fellow Drexel graduate, Norman Joseph Woodland (1921-2012), and together, they started work on developing solutions[1].
The first solution involved using fluorescent/ultraviolet ink as a medium of printing product information. However, logistical issues such as the cost of infrastructure and the tendency of the ink to fade too quickly rendered this approach unviable. However, this setback did not demotivate Woodland, who spent the winter of 1948-49 thinking up potential designs at his grandparents’ house in Miami Beach, FL.
Being a scout, and having served in the US military as a technical assistant with the Manhattan Project, Woodland was familiar with communication via Morse Code (more on this later).
One day, whilst sitting on the beach in Florida, Woodland had a breakthrough that would go on to transform the role of technology in retail forever. The breakthrough, in his own words:
“
What I’m going to tell you sounds like a fairy tale. I poked my four fingers into the sand and for whatever reason — I didn’t know — I pulled my hand toward me and drew four lines. I said: ‘Golly! Now I have four lines, and they could be wide lines and narrow lines instead of dots and dashes.
”
Norman Joseph Woodland
From a 1999 interview with Smithsonian magazine[1]
Woodland managed to draw a parallel (pun intended) between 1D morse code and 2D lines. He presented this breakthrough to Silver, and on 20th October 1949, they applied for a patent on the idea under the title “Classifying Apparatus and Method“. Almost exactly 3 years later, on 7th October 1952, the patent was awarded, covering both the linear design mentioned above, and a ‘bullseye’ design, also developed by Woodland. Woodland actually preferred the bullseye design as it was orientation-agnostic. However, logistics once again got in the way, as the scanner required to ingest a circular barcode was much too resource-intensive and expensive for commercial use.
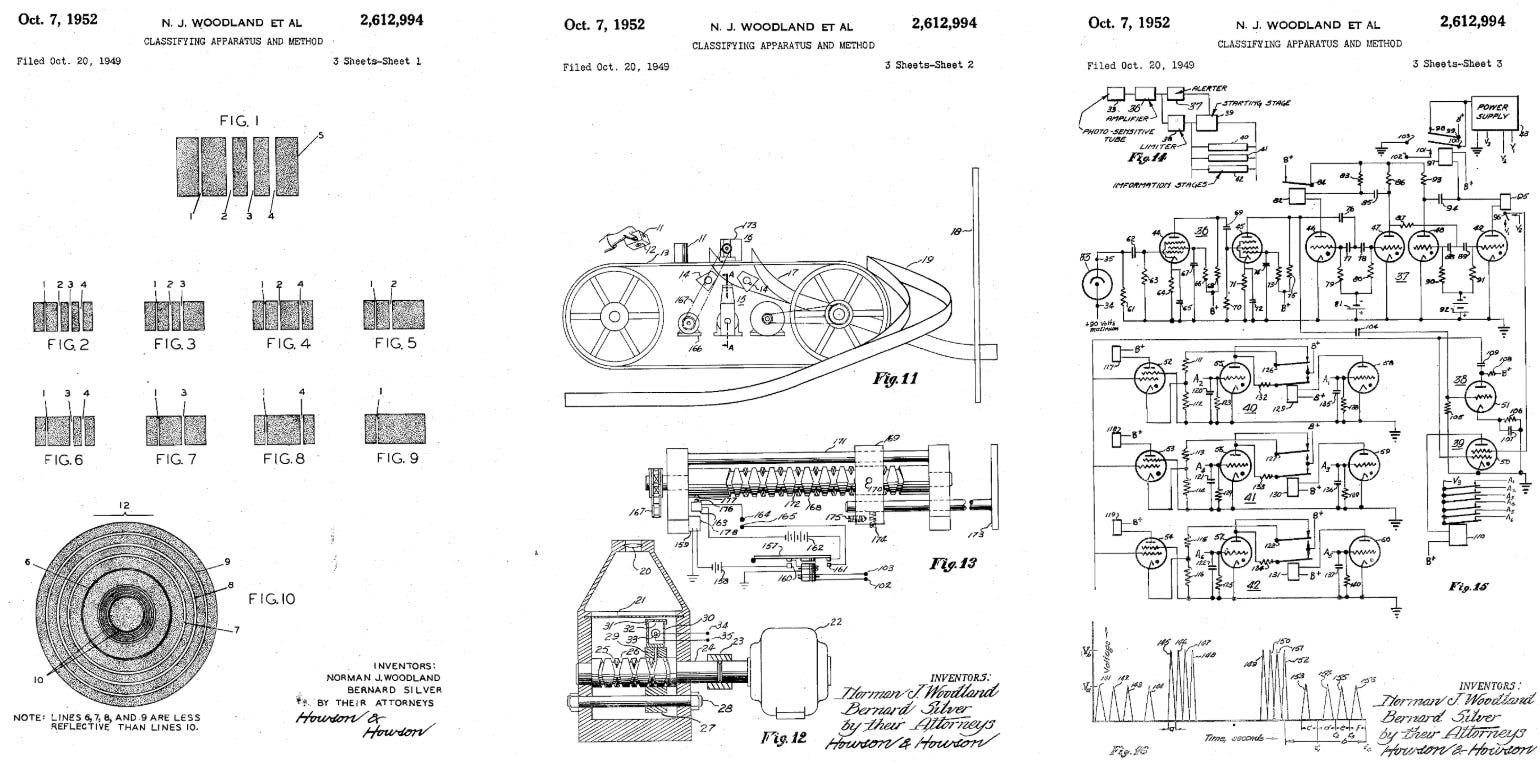
Fig. 1 - Woodland & Silver’s drawings from the original patent [3]
In 1951, prior to the awarding of the patent, Woodland was working with IBM, who, in spite of Woodland’s pleas, refused to progress the concept due to commercial infeasibility. The patent was sold for $15,000 to the Philadelphia Battery Company (PhilCo), who swiftly re-sold it to the Radio Corporation of America (RCA) in late 1952. The RCA held this patent until its expiry in 1969 without furthering the development of the system.
In this time, however, there was another, seemingly unrelated problem that needed solving in the rail industry. Namely, tracking the movement of trains on American railway systems. Up until the 1960s, tracking trains on the national rail system was an entirely manual process. “Scouts” were employed to watch the trains and note down the serial numbers as they passed by. This manual process was fraught with human error, which led to cases of trains going missing or ending up being transferred onto the wrong rail network.
David Jarrett Collins (1938-2022), an MIT graduate working at Sylvania (GTE) was intrigued by this problem and approached his employer regarding the development of a standardised solution. He was aware of the work of Woodland and Silver and that their idea was patented. A black and white barcode, however, was not a suitable solution for trains due to variables such as weather conditions and debris rendering the codes unreadable. What would be required was a particularly reflective material that could be scanned whilst moving at speed and wasn’t as prone to limitations introduced by poor atmospheric conditions or unwanted debris.
The solution was KarTrak, a system that involved using coloured Scotchlite tape on the side of the trains as a unique identifier. Encoded within this format was:
Check Digit
Start Label
Car number
Equipment/Owner code
Stop Label
Without going into the specifics of this encoding system or veering too far off track (pun once again intended) from barcodes, an important thing to note is that this system showcased the application of a structured linear code format that, thanks to xenon lamps and the invention of laser technology in the early 1960s, was machine-readable by trackside scanners.

Fig. 2 - A KarTrak code on the side of a container [7]
KarTrak ultimately fell short by way of logistics, with many companies reluctant to adopt the system, and those that did finding themselves spending excess amounts of time cleaning and maintaining the codes to ensure readability. The rate of successful scans wasn’t high enough for the railroads to fully rely on KarTrak, ultimately leading to its discontinuation in 1977.
While KarTrak was being trialled out, the RCA (the most recent barcode patent holders at that time) acquired the interest of the National Association of Food Chains, who subsequently formed the U.S. Supermarket Ad Hoc committee. This committee was primarily devoted to the acceleration of a “Uniform Grocery Product Code”. Around this time, IBM sent Woodland to their North Carolina facility to work alongside George J Laurer (1925-2019), among others, on the development of the Universal Product Code (UPC).
With Intel releasing the Intel 4004, the world’s first commercial microprocessor, in 1971 and laser technology continuing on its journey of maturation and evolution, the prospect of performing product scanning in-store was quickly becoming a reality. What remained was for the industry to agree on a standard format that would be used to encode product information.
One of the primary challenges was satisfying a set of essential criteria. The UPC needed to be:
Machine-readable via a commercially feasible scanner
Human-readable as a fallback option, in case the scanner wasn’t working
Physically compressible to a size that ensured feasibility for printing and reading across variable product and packaging sizes
Printable on different types of surface materials
In 1972, the RCA began to trial out the bullseye pattern in a Kroger store in Cincinnati. Technically, this was the first solution that managed to make it to market. Unfortunately, the bullseye code was very prone to data corruption due to the ink that the codes were printed with spreading (known as printing gain). Any minor discrepancy would lead to an invalid code that could not be deciphered by any scanner. However, the trial launch was not in vain for the wider race, as this failure would provide a pivotal insight to assist IBM in designing their own solution.

Fig. 3 - RCA “bullseye” code on a tin of green beans [7]
At IBM, Laurer was working hard to design a code that would not fall victim to the very minor discrepancies caused by printing gain. When asked about designing another bullseye code, he is quoted as saying:
“
My nature and my training would not allow me to support something I didn’t believe in
”
George J Laurer[6]
One of the main advantages of the bullseye approach was the ability to scan the code from any orientation. This is not something that could be achieved with a linear barcode, but perhaps the existing linear approaches could be expanded upon to make the codes readable when “upside-down”, that is, rotated 180° from its intended orientation. He also wanted to introduce some form of data redundancy into the system; if the codes were of a “predictable” format, they would be less susceptible to minor physical discrepancies. The idea being, once the core information remained intact, the system should be robust enough to self-correct any minor inconsistencies.
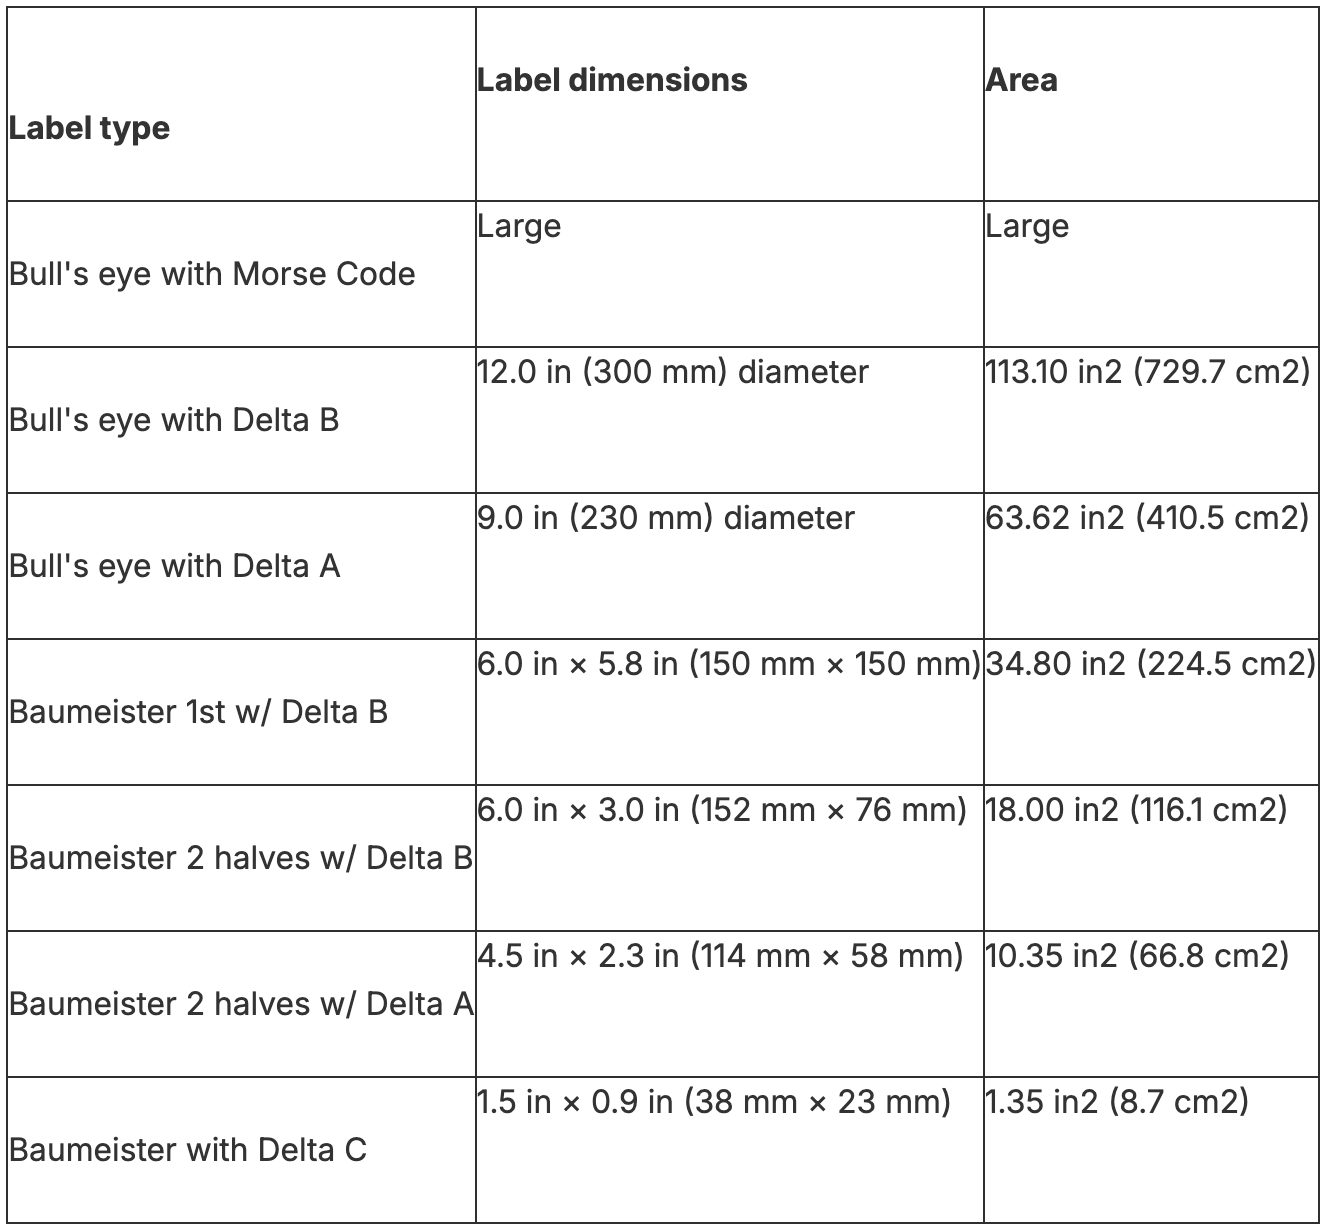
Fig. 4 - Physical barcode size comparison from early prototypes [7]
Laurer, with the help of his 15 year old son, Craig, designed a solution that would change the world of retail forever. The solution, a 12 digit, 30 bar linear code divided into two halves that applied mathematics to facilitate data redundancy and bidirectional scanning.
Below is a newspaper excerpt from April 1973 that showcases the finalists of the Uniform Grocery Product Code Council’s competition.

Fig. 5 - The finalists for the design of an industry-standard barcode [1]
Laurer’s design secured victory for IBM, and over 50 years after this design was chosen, a variation of this code is scanned approximately 6 billion times per day.
In June 1974, a packet of Wrigley’s chewing gum became the first UPC-A barcoded product to be scanned at checkout. It took some time for this technology to travel across the Atlantic, with the first product scanned in the UK, a box of Melrose teabags being scanned in October 1979.
It’s worth noting that there are now over 100 types of barcodes that have all been developed for slightly different scenarios and use-cases. However, in spite of all of these variations, the UPC-A code remains, to this day, one of the most commonly used codes in retail.
The Science of the Barcode
Now that we understand the origin of barcodes, let’s dig into the science of how they work. How does a series of lines with some numbers underneath tell the checkout system that you’ve got an egg & cress sandwich in your hand?
As we have already alluded to, the origins of the barcode’s distinctive pattern were inspired by Morse Code.
Morse Code is an internationally recognised standard of encoding that allows the transfer of information through a series of dots, dashes and spaces. This transfer can be achieved using any mechanism that facilitates the expression of binary state. More simply, anything that can be ‘on’ or ‘off’. Telegraphs and flashlights were common mediums for such communication in the 20th century. In the case of a flashlight, the bulb being’ ‘on’ for one unit of time represents a dot, hold that state for 3 units of time and you have a dash. The bulb being turned off represents a space between the aforementioned signals. The International Morse Code standard is detailed below:

Fig. 6 - International Morse Code [2]
Let’s say you wanted to greet somebody in morse code, you could blink your flashlight on and off with the following pattern:
.... . .-.. .-.. ---
h e l l o
Going back to the lines in the sand, what did Woodland mean when he said “Now I have four lines, and they could be wide lines and narrow lines instead of dots and dashes“?
Well, let’s take our "hello” message from above, and extend the dots and dashes down.
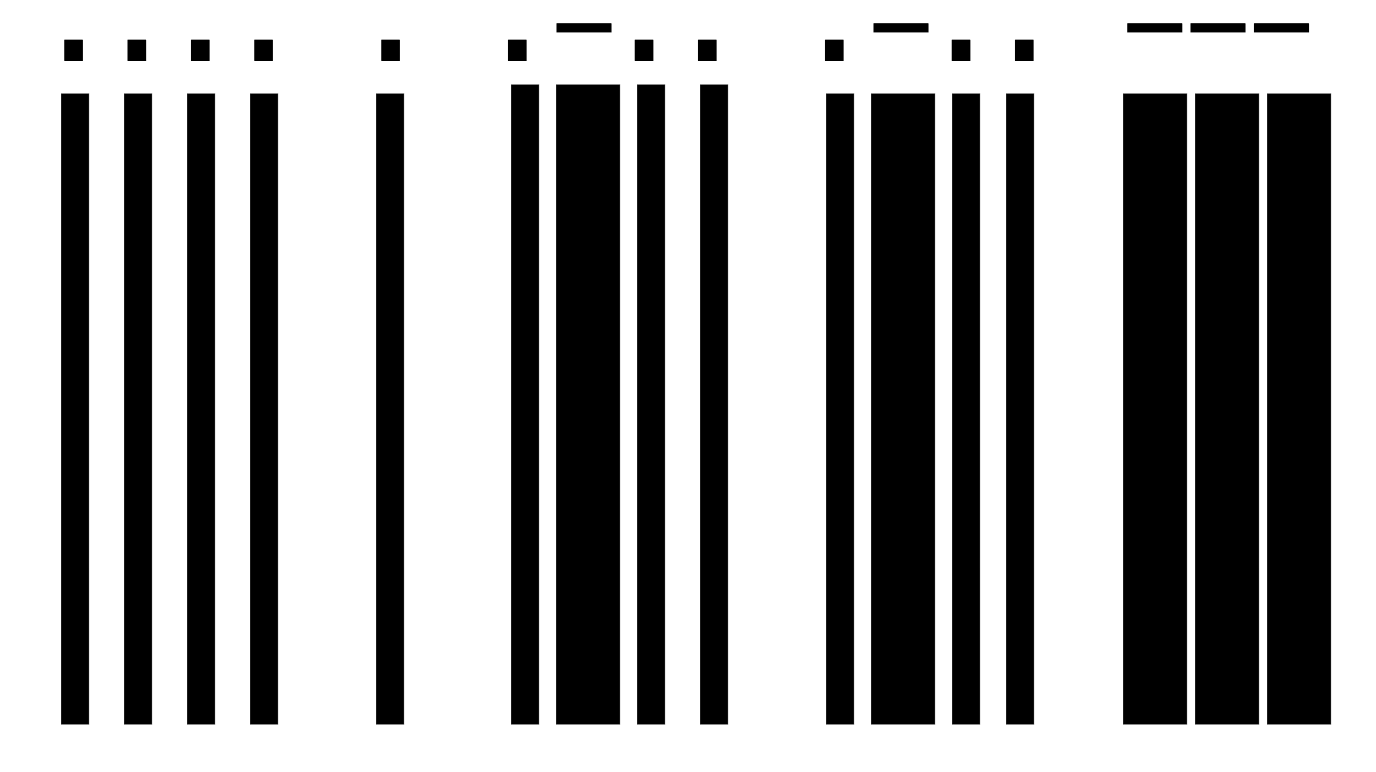
Fig. 7 - 2D Morse Code
Now we’re getting somewhere. So, is this what barcodes are? 2D Morse Code?
Not really. Whilst you could easily develop a system that could decode the above sequence, it would be prone to the same issues that prevented the RCA’s bullseye code from making it out of a Kroger in Cincinnati.
Laurer’s UPC-A code design is a lot more sophisticated than just being 2D Morse Code. However, the above illustration does bear a striking resemblance to the UPCs that we see today, and to the untrained eye, could very possibly be mis-identified as a UPC code.
So if barcodes aren’t 2D Morse Code, then what are they? How did we get from Woodland’s lines in the Florida sand to Laurer’s groundbreaking UPC design? And why is it the case that this code has been trusted to identify billions of products over the last half-century?
To illustrate, I decided to grab the first barcoded object I could find in my own house. In Europe (where I live), the European Article Number (EAN) is the most popular form of barcode. Thankfully, a friend of mine who recently returned from a trip across the Atlantic provided me with a product that has a UPC barcode.
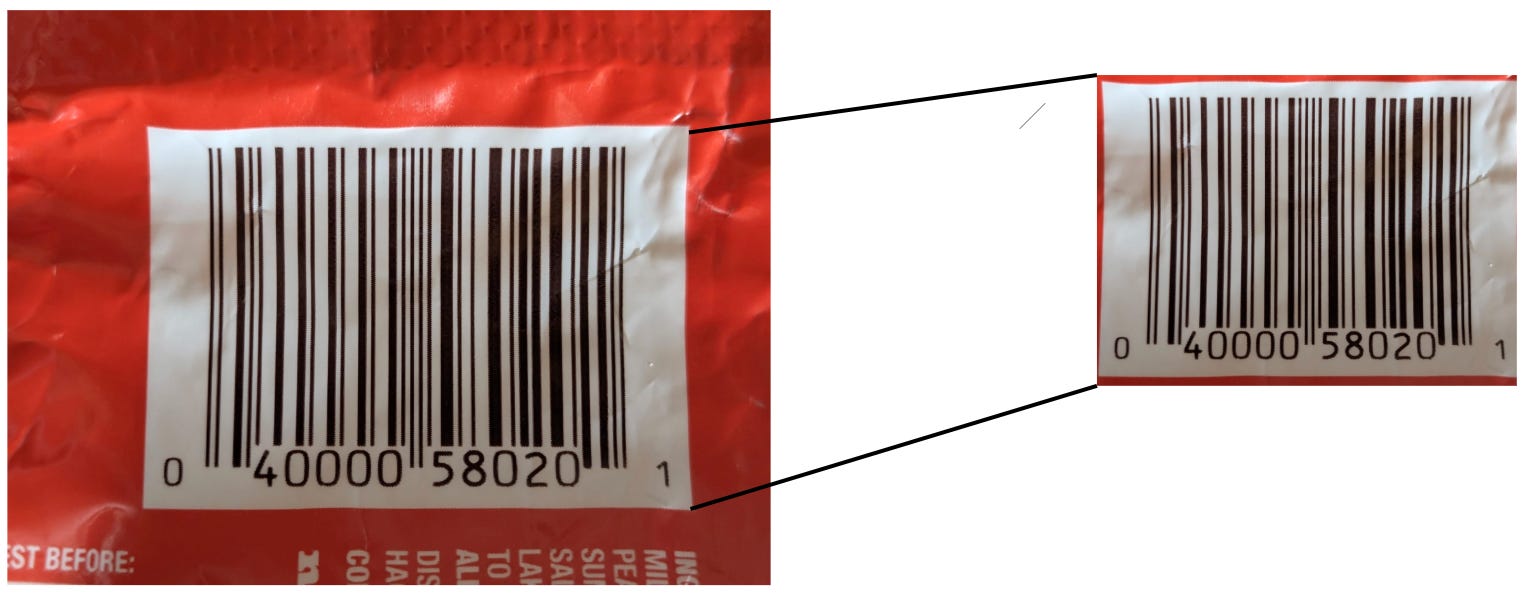
Fig 8 - From my kitchen - A pack of M&Ms and its UPC barcode
As we’ve already mentioned, some bars are thicker than others, in fact there are 4 unique widths, each being 1-4 “units” wide, respectively. So how is the computer interpreting this? Well, the units of width (known as the x-dimension) are quite important here, as the computer will be reading the barcode unit-by-unit rather than bar-by-bar. As with the 2D Morse code example, if we imagine a black unit to be a 1 and a white unit to be a 0, then we can represent the barcode as a series of 1s and 0s (the binary digits). From hereon in, I’m going to refer to the individual units seen in the barcodes as “bits”.
This barcode (being of type UPC-A) is 95 bits wide[4]. Going from left to right, as it appears in the image, the M&Ms barcode has the following bit representation:
10100011010100011000110100011010001101000110101010100111010010001110010110110011100101100110101
This may look like a random binary string, but there is a method to the madness.
UPC-A binary strings follow a strict format in order to assist scanners and mitigate the risk of tampering. The important things to note for the UPC-A format are as follows:
The code must start and end with 101 (the start and end guard patterns, respectively).
The code must have a center guard pattern, with the value 01010.
Digits between the end of the start guard pattern and the beginning of the center guard pattern are known as “left-sided” digits.
Digits between the end of the center guard pattern and the beginning of the end guard pattern are known as “right-sided” digits.
The code must be 95 bits long, inclusive of guard patterns, this means that there must be 42 left and right sided bits, respectively (3 + 42 + 5 + 42 + 3).
Breaking the string up a little bit, we get:
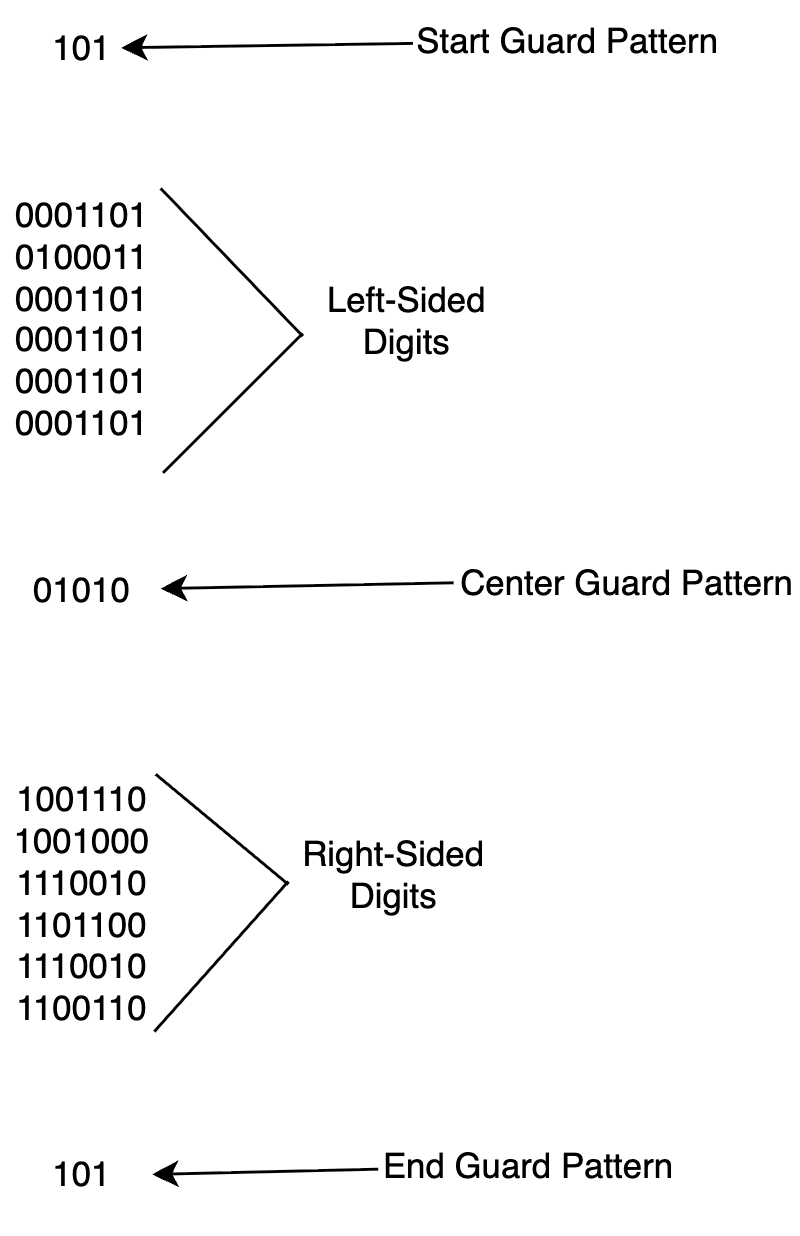
Fig. 9 - Breaking down our binary code
UPC-A adheres to the format SLLLLLLMRRRRRRE, where S indicates the start pattern, L indicates the left-side digits, M represents the center pattern, R represents the right-side digits and E represents the end pattern. The purpose of the start, middle and end patterns is to provide a frame of reference that barcode scanners can use to orient themselves to read the code. These patterns allow scanners to determine the x-dimension, which informs them of the physical size of the barcode.
You’ll notice that I’ve split the binary representation of the left-sided and right-sided digits into groups of 7 bits. Those familiar with binary may be rather confused by this, shouldn’t the length be a power of 2? As mentioned above, the left and right parts of the barcode each consist of 42 bits, so in order to split them evenly, each digit would have to have either 2, 6, 7 or 21 bits associated with it. 7 is the standard in UPC-A, and it was chosen as it facilitates encoding the digits 0-9 with unique bit representations, ensures that codes can be scanned bidirectionally and ensures that there is a degree of data redundancy so that code corruption caused by physical or interpreted discrepancies can be self-corrected.
The easiest way to explain these rules is to first look at the defined code mappings, which are different for each side of the barcode and for each orientation (a total of 4 mappings):
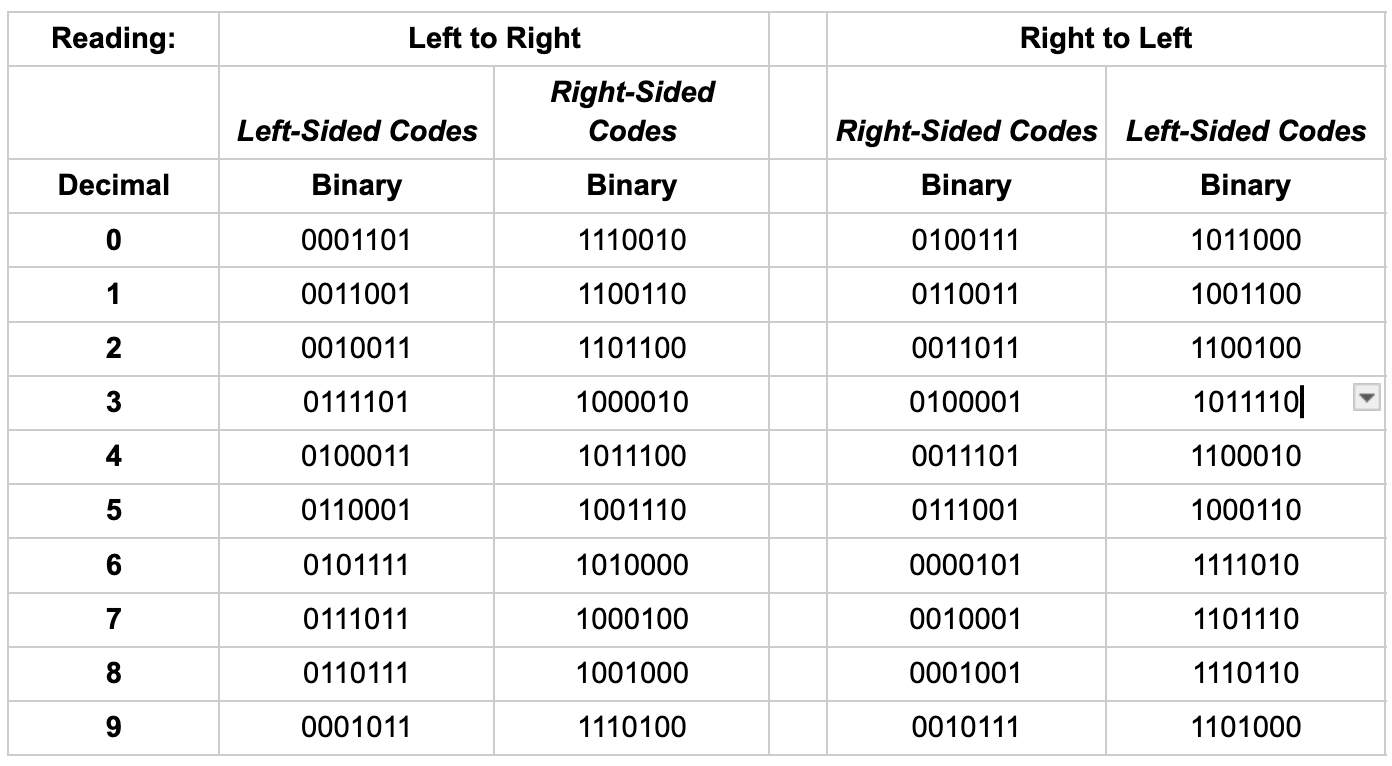
Fig. 10 - UPC-A decimal-binary mappings [9]
As mentioned, these mappings are doing much more than just providing a binary representation of a decimal number. Some of the patterns that you’ll notice are:
Reading left-to-right:
Left-sided codes always start with a 0 and end with a 1
Right-sided codes always start with a 1 and end with a 0
Left-sided codes always have an odd number of “1” bits (this is called odd parity)
Right-sided codes always have an even number of “1” bits (even parity)
Reading right-to-left:
Right-sided codes always start with a 0 and end with a 1
Left-sided codes always start with a 1 and end with a 0
Right-sided codes always have odd parity
Left-sided codes always have even parity
In both cases, you’ll also notice that the respective left and right representations are inverse of one another, i.e. 0001101 on the left is mirrored by 1110010 on the right.
Using this formula, we can convert our M&Ms barcode binary to digits:

So the resulting code that we get is:
040000 580201
Does this look familiar? Take a look at the decimal digits at the bottom of the M&M barcode:
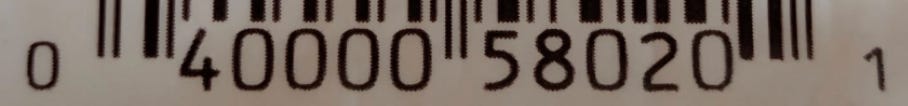
Fig. 11 - The decimal digits at the bottom of the M&Ms barcode
We’ve now managed to convert the 30 bars into the 12 digits that are present on the barcode, which doesn’t sound like very much. However, you may be wondering why the 0 at the start and the 1 at the end of the code are all on their own, to the point where they don’t even look like they’re part of the barcode.
Why are these numbers so far away from the rest? Are they even part of the barcode? Well, the answer to those questions lies in (even more) formatting.
The first digit is the number system digit. This digit tells the scanner the variation of the code that it is reading. For UPC codes, the ranges 0-1 and 6-9 represent a “regular” variation. In this variation, the LLLLL characters represent the GS1-assigned manufacturer code (unique manufacturer ID), the RRRRR characters represent the product code. So from this, we can learn that Mars Inc., the M&Ms manufacturer, has a manufacturer code of 40000[8], meaning that any product that has a barcode with those left values is manufactured by Mars. It then tells us that the product ID of the bag of M&Ms is 58020.
We’ve established that the first digit is part of the barcode, but what about that lonely “1” on the right-hand side? The origin of that digit is a little bit more complicated. That number is called the check digit. The check digit acts as a validation method for the entire barcode. To calculate it, we need to do some modular arithmetic.
Let’s define the first 11 characters of a UPC code as having the format:
A BCDEF GHIJK
To calculate the 12th and final digit, we plug the values into the following formula:
Filling in the M&Ms barcode, we get:
The output of that is 1, which matches the number on the M&Ms bag. If that number did not match, then a scanner would not recognise it as a valid UPC barcode. So, as to whether the two lonely digits are part of the barcode, we’ve confirmed that they most certainly are.
The same process can be followed using the right-to-left mappings when reading the barcode upside-down. The scanner is able to use the odd/even parities to determine the orientation of the barcode and hence validate the values.
With all of these constraints, it raises the question, how many unique UPC-A barcodes are there? This can be calculated using
Where pl is the possible number of left digits, dl is the number of left digits, pr is the possible number of right digits, and dr is the number of right digits. Filling in, we get:
That’s 100 billion possible UPC-A codes!
So as you depart your local corner store, repulsive lunch in-hand, you realise how for all of this time, you have taken a very smart and well-researched piece of technology for granted. For over 50 years, barcodes have turned the job of inventory management into a trivial task. They say that the creators of truly great inventions are often forgotten as their creations long outlive the inventors themselves. In the case of the barcode, I believe that this is certainly the case.
A Final Note
I was inspired to write this article while reading “Code: The Hidden Language of Computer Hardware and Software“ by Charles Petzold. In Chapter 9, he uses barcodes as a fantastic example of how binary systems can represent information. I would thoroughly recommend anybody, technical or non-technical, to read his book, as he explains the origins and evolution of computing in a digestible but thoroughly detailed manner.
References:
[1] https://www.gs1uk.org/insights/news/the-history-of-the-barcode
[2] https://en.wikipedia.org/wiki/Morse_code
[3] https://patents.google.com/patent/US2612994A/en
[4] https://en.wikipedia.org/wiki/Universal_Product_Code
[5] https://www.findagrave.com/memorial/183044414/samuel-friedland
[6] https://www.ibm.com/history/george-laurer
[7] https://barkoder.com/blog/from-beeps-to-understanding-the-evolution-of-the-barcode
[8] https://www.upcitemdb.com/info-mars-inc
[9] https://en.wikipedia.org/wiki/Code:_The_Hidden_Language_of_Computer_Hardware_and_Software